K Means Clustering
Exploring the K-Means Clustering Algorithm
 Program output
K-Means Clustering
This README file provides information on K-Means Clustering and its implementation. K-Means is an iterative algorithm that determines centroids and assigns points to clusters based on their proximity to the centroids. Below is a breakdown of the content covered in this README.
Table of Contents
- Part A: K Means Clustering
- Part B: Exploratory Data Analysis (EDA)
- Part C: Plotting Scatter Plot for the Data
- Part D: Implementing K-Means
- Part E: Testing Different Values of K
- Part F: Elbow Method for Determining Optimum Number of Clusters
- Conclusion
- Part G: Implementing K-Means on the Iris Dataset
Part A: K Means Clustering
In this section, the K Means Clustering algorithm is introduced. The make_blobs function from sklearn.datasets is used to generate a synthetic dataset for demonstration purposes.
Part B: Exploratory Data Analysis (EDA)
This section discusses the process of performing exploratory data analysis on the generated dataset.
Part C: Plotting Scatter Plot for the Data
A scatter plot is created to visualize the generated dataset.
Part D: Implementing K-Means
The K-Means algorithm is implemented using the KMeans class from sklearn.cluster. The cluster centers, labels, and number of iterations are displayed. Implementation can be found here.
Part E: Testing Different Values of K
In this section, the K-Means algorithm is tested for different values of K. The cluster centers, labels, and number of iterations are displayed.
Part F: Elbow Method for Determining Optimum Number of Clusters
The elbow method is applied to determine the optimum number of clusters for the dataset. The sum of squared distances from each point to its centroid is plotted against the number of clusters.
Conclusion
Based on the elbow curve, the optimum number of clusters is determined.
Part G: Implementing K-Means on the Iris Dataset
K-Means is implemented on the Iris dataset, similar to the previous sections. The results are visualized using a scatter plot.
Use the provided instructions and code examples to explore and understand the implementation of K-Means Clustering.
# import libraries
import matplotlib.pyplot as plt
import numpy as np
import pandas as pd
import seaborn as sns
K Means Clustering
An iterative algorithm by determining centroids and seeing what points belong to what cluster.
from sklearn.datasets import make_blobs
# Generating the dataset
# Classes denote the labels here:
dataset, classes = make_blobs(n_samples = 200, n_features = 2, centers = 4, cluster_std = 0.5, random_state = 4)
df = pd.DataFrame(dataset, columns = ['var1', 'var2'])
EDA:
df.head()
| var1 | var2 | |
|---|---|---|
| 0 | 8.849101 | 0.971861 |
| 1 | 9.445254 | 0.757423 |
| 2 | 9.312064 | 4.321058 |
| 3 | 2.853544 | -4.284808 |
| 4 | 9.504228 | -9.727242 |
<script>
const buttonEl =
document.querySelector('#df-56c1e0fe-b222-47bf-a061-5cda6263c65a button.colab-df-convert');
buttonEl.style.display =
google.colab.kernel.accessAllowed ? 'block' : 'none';
async function convertToInteractive(key) {
const element = document.querySelector('#df-56c1e0fe-b222-47bf-a061-5cda6263c65a');
const dataTable =
await google.colab.kernel.invokeFunction('convertToInteractive',
[key], {});
if (!dataTable) return;
const docLinkHtml = 'Like what you see? Visit the ' +
'<a target="_blank" href=https://colab.research.google.com/notebooks/data_table.ipynb>data table notebook</a>'
+ ' to learn more about interactive tables.';
element.innerHTML = '';
dataTable['output_type'] = 'display_data';
await google.colab.output.renderOutput(dataTable, element);
const docLink = document.createElement('div');
docLink.innerHTML = docLinkHtml;
element.appendChild(docLink);
}
</script>
</div>
df.shape
(200, 2)
df.describe()
| var1 | var2 | |
|---|---|---|
| count | 200.000000 | 200.000000 |
| mean | 8.126561 | -2.549506 |
| std | 2.428462 | 5.513808 |
| min | 2.853544 | -11.093749 |
| 25% | 7.448818 | -7.172446 |
| 50% | 9.294925 | -2.259600 |
| 75% | 9.682409 | 2.294496 |
| max | 10.877971 | 5.162519 |
<script>
const buttonEl =
document.querySelector('#df-df81f65a-6d56-41f5-ae37-24d9a6b5e81f button.colab-df-convert');
buttonEl.style.display =
google.colab.kernel.accessAllowed ? 'block' : 'none';
async function convertToInteractive(key) {
const element = document.querySelector('#df-df81f65a-6d56-41f5-ae37-24d9a6b5e81f');
const dataTable =
await google.colab.kernel.invokeFunction('convertToInteractive',
[key], {});
if (!dataTable) return;
const docLinkHtml = 'Like what you see? Visit the ' +
'<a target="_blank" href=https://colab.research.google.com/notebooks/data_table.ipynb>data table notebook</a>'
+ ' to learn more about interactive tables.';
element.innerHTML = '';
dataTable['output_type'] = 'display_data';
await google.colab.output.renderOutput(dataTable, element);
const docLink = document.createElement('div');
docLink.innerHTML = docLinkHtml;
element.appendChild(docLink);
}
</script>
</div>
df.info()
<class 'pandas.core.frame.DataFrame'>
RangeIndex: 200 entries, 0 to 199
Data columns (total 2 columns):
# Column Non-Null Count Dtype
--- ------ -------------- -----
0 var1 200 non-null float64
1 var2 200 non-null float64
dtypes: float64(2)
memory usage: 3.2 KB
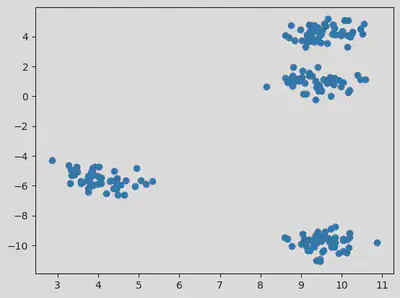
Plotting a scatter plot for the data:
plt.scatter(df["var1"], df["var2"])

# plt.scatter(df["var1"], df["var2"], c = classes, cmap = "autumn")
# c = y gives colour to the marker, where y contains the labels corresponding to X.
# Different color to each cluster is given.
<matplotlib.collections.PathCollection at 0x7f9a6ff43730>
# Implementing K Means
from sklearn.cluster import KMeans
kmeans = KMeans(3)
kmeans.fit(df)
/usr/local/lib/python3.9/dist-packages/sklearn/cluster/_kmeans.py:870: FutureWarning: The default value of `n_init` will change from 10 to 'auto' in 1.4. Set the value of `n_init` explicitly to suppress the warning
warnings.warn(
KMeans(n_clusters=3)In a Jupyter environment, please rerun this cell to show the HTML representation or trust the notebook.
On GitHub, the HTML representation is unable to render, please try loading this page with nbviewer.org.
KMeans(n_clusters=3)
kmeans.cluster_centers_ # Showing the coordinates of the 3 centroids.
array([[ 9.46804954, 2.58913818],
[ 4.0198448 , -5.56017705],
[ 9.55029935, -9.81612371]])
kmeans.labels_ # Since we took KMeans(3), we only get 0, 1, 2 values
array([0, 0, 0, 1, 2, 0, 1, 0, 2, 2, 0, 2, 1, 2, 2, 1, 0, 0, 1, 0, 1, 2,
1, 0, 0, 1, 2, 1, 0, 1, 0, 0, 0, 1, 2, 2, 0, 1, 0, 0, 0, 0, 1, 1,
0, 2, 0, 0, 2, 2, 0, 0, 0, 0, 1, 0, 1, 0, 2, 0, 1, 2, 0, 0, 1, 2,
0, 0, 1, 1, 0, 2, 0, 0, 2, 2, 0, 2, 0, 2, 0, 2, 0, 0, 0, 1, 0, 2,
0, 0, 0, 1, 0, 0, 2, 0, 2, 2, 0, 2, 0, 0, 2, 2, 0, 1, 1, 0, 2, 0,
2, 2, 0, 0, 0, 0, 1, 1, 0, 0, 1, 2, 2, 1, 1, 0, 0, 2, 0, 0, 0, 0,
1, 0, 2, 1, 2, 2, 0, 0, 0, 0, 2, 2, 1, 0, 0, 0, 2, 0, 0, 2, 2, 1,
1, 1, 0, 2, 2, 0, 0, 0, 0, 2, 0, 0, 1, 0, 0, 0, 0, 0, 0, 0, 2, 0,
1, 0, 0, 1, 0, 2, 0, 0, 1, 0, 1, 1, 1, 1, 0, 1, 1, 1, 1, 2, 1, 1,
2, 1], dtype=int32)
kmeans.n_iter_
2
# Plotting the scatter for the 3 clusters with each cluster have a separate colour.
three_clusters = kmeans.fit_predict(df)
df_with_clusters = df.copy()
df_with_clusters["clusters"] = three_clusters
/usr/local/lib/python3.9/dist-packages/sklearn/cluster/_kmeans.py:870: FutureWarning: The default value of `n_init` will change from 10 to 'auto' in 1.4. Set the value of `n_init` explicitly to suppress the warning
warnings.warn(
df_with_clusters.head()
| var1 | var2 | clusters | |
|---|---|---|---|
| 0 | 8.849101 | 0.971861 | 0 |
| 1 | 9.445254 | 0.757423 | 0 |
| 2 | 9.312064 | 4.321058 | 0 |
| 3 | 2.853544 | -4.284808 | 2 |
| 4 | 9.504228 | -9.727242 | 1 |
<script>
const buttonEl =
document.querySelector('#df-a133430e-b29b-4e85-90c9-a84c4eaee112 button.colab-df-convert');
buttonEl.style.display =
google.colab.kernel.accessAllowed ? 'block' : 'none';
async function convertToInteractive(key) {
const element = document.querySelector('#df-a133430e-b29b-4e85-90c9-a84c4eaee112');
const dataTable =
await google.colab.kernel.invokeFunction('convertToInteractive',
[key], {});
if (!dataTable) return;
const docLinkHtml = 'Like what you see? Visit the ' +
'<a target="_blank" href=https://colab.research.google.com/notebooks/data_table.ipynb>data table notebook</a>'
+ ' to learn more about interactive tables.';
element.innerHTML = '';
dataTable['output_type'] = 'display_data';
await google.colab.output.renderOutput(dataTable, element);
const docLink = document.createElement('div');
docLink.innerHTML = docLinkHtml;
element.appendChild(docLink);
}
</script>
</div>
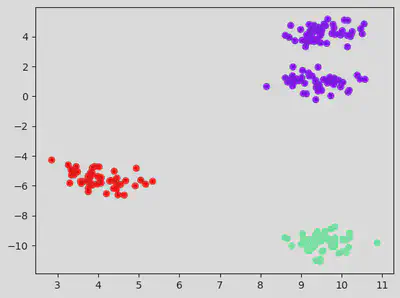
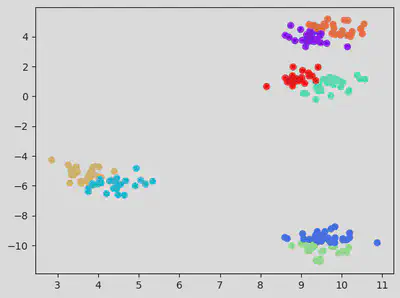
plt.scatter(df_with_clusters["var1"], df_with_clusters["var2"], c = df_with_clusters['clusters'], cmap = "rainbow")
<matplotlib.collections.PathCollection at 0x7f9a6c37ea30>
Testing for K value of 4
kmeans = KMeans(4)
kmeans.fit(df)
kmeans.cluster_centers_ # Showing the coordinates of the 3 centroids.
kmeans.labels_ # Since we took KMeans(3), we only get 0, 1, 2 values
kmeans.n_iter_
/usr/local/lib/python3.9/dist-packages/sklearn/cluster/_kmeans.py:870: FutureWarning: The default value of `n_init` will change from 10 to 'auto' in 1.4. Set the value of `n_init` explicitly to suppress the warning
warnings.warn(
2
four_clusters = kmeans.fit_predict(df)
df_with_clusters = df.copy()
df_with_clusters["clusters"] = four_clusters
/usr/local/lib/python3.9/dist-packages/sklearn/cluster/_kmeans.py:870: FutureWarning: The default value of `n_init` will change from 10 to 'auto' in 1.4. Set the value of `n_init` explicitly to suppress the warning
warnings.warn(
df_with_clusters.head()
| var1 | var2 | clusters | |
|---|---|---|---|
| 0 | 8.849101 | 0.971861 | 3 |
| 1 | 9.445254 | 0.757423 | 3 |
| 2 | 9.312064 | 4.321058 | 1 |
| 3 | 2.853544 | -4.284808 | 0 |
| 4 | 9.504228 | -9.727242 | 2 |
<script>
const buttonEl =
document.querySelector('#df-db68b95d-bb6c-4368-a948-98ed3900df2f button.colab-df-convert');
buttonEl.style.display =
google.colab.kernel.accessAllowed ? 'block' : 'none';
async function convertToInteractive(key) {
const element = document.querySelector('#df-db68b95d-bb6c-4368-a948-98ed3900df2f');
const dataTable =
await google.colab.kernel.invokeFunction('convertToInteractive',
[key], {});
if (!dataTable) return;
const docLinkHtml = 'Like what you see? Visit the ' +
'<a target="_blank" href=https://colab.research.google.com/notebooks/data_table.ipynb>data table notebook</a>'
+ ' to learn more about interactive tables.';
element.innerHTML = '';
dataTable['output_type'] = 'display_data';
await google.colab.output.renderOutput(dataTable, element);
const docLink = document.createElement('div');
docLink.innerHTML = docLinkHtml;
element.appendChild(docLink);
}
</script>
</div>
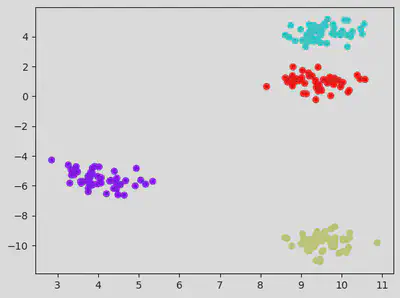
plt.scatter(df_with_clusters["var1"], df_with_clusters["var2"], c = df_with_clusters['clusters'], cmap = "rainbow")
<matplotlib.collections.PathCollection at 0x7f9a6c26fee0>
Testing for default K value (which is 8).
kmeans = KMeans()
kmeans.fit(df)
kmeans.cluster_centers_ # Showing the coordinates of the 3 centroids.
kmeans.labels_ # Since we took KMeans(3), we only get 0, 1, 2 values
kmeans.n_iter_

clusters = kmeans.fit_predict(df)
df_with_clusters = df.copy()
df_with_clusters["clusters"] = clusters
/usr/local/lib/python3.9/dist-packages/sklearn/cluster/_kmeans.py:870: FutureWarning: The default value of `n_init` will change from 10 to 'auto' in 1.4. Set the value of `n_init` explicitly to suppress the warning
warnings.warn(
/usr/local/lib/python3.9/dist-packages/sklearn/cluster/_kmeans.py:870: FutureWarning: The default value of `n_init` will change from 10 to 'auto' in 1.4. Set the value of `n_init` explicitly to suppress the warning
warnings.warn(
df_with_clusters.head()
| var1 | var2 | clusters | |
|---|---|---|---|
| 0 | 8.849101 | 0.971861 | 7 |
| 1 | 9.445254 | 0.757423 | 3 |
| 2 | 9.312064 | 4.321058 | 0 |
| 3 | 2.853544 | -4.284808 | 5 |
| 4 | 9.504228 | -9.727242 | 1 |
<script>
const buttonEl =
document.querySelector('#df-3a5ae0c7-8c43-4af2-a819-3d2cd9dba91a button.colab-df-convert');
buttonEl.style.display =
google.colab.kernel.accessAllowed ? 'block' : 'none';
async function convertToInteractive(key) {
const element = document.querySelector('#df-3a5ae0c7-8c43-4af2-a819-3d2cd9dba91a');
const dataTable =
await google.colab.kernel.invokeFunction('convertToInteractive',
[key], {});
if (!dataTable) return;
const docLinkHtml = 'Like what you see? Visit the ' +
'<a target="_blank" href=https://colab.research.google.com/notebooks/data_table.ipynb>data table notebook</a>'
+ ' to learn more about interactive tables.';
element.innerHTML = '';
dataTable['output_type'] = 'display_data';
await google.colab.output.renderOutput(dataTable, element);
const docLink = document.createElement('div');
docLink.innerHTML = docLinkHtml;
element.appendChild(docLink);
}
</script>
</div>
plt.scatter(df_with_clusters["var1"], df_with_clusters["var2"], c = df_with_clusters['clusters'], cmap = "rainbow")
<matplotlib.collections.PathCollection at 0x7f9a6c3ae8e0>
Elbow method for determining the optimum number of clusters
optimum = []
for i in range(1, 10):
  kmeans = KMeans(i)
  kmeans.fit(df)
  opti_cluster = kmeans.inertia_
  optimum.append(opti_cluster)
/usr/local/lib/python3.9/dist-packages/sklearn/cluster/_kmeans.py:870: FutureWarning: The default value of `n_init` will change from 10 to 'auto' in 1.4. Set the value of `n_init` explicitly to suppress the warning
warnings.warn(
/usr/local/lib/python3.9/dist-packages/sklearn/cluster/_kmeans.py:870: FutureWarning: The default value of `n_init` will change from 10 to 'auto' in 1.4. Set the value of `n_init` explicitly to suppress the warning
warnings.warn(
/usr/local/lib/python3.9/dist-packages/sklearn/cluster/_kmeans.py:870: FutureWarning: The default value of `n_init` will change from 10 to 'auto' in 1.4. Set the value of `n_init` explicitly to suppress the warning
warnings.warn(
/usr/local/lib/python3.9/dist-packages/sklearn/cluster/_kmeans.py:870: FutureWarning: The default value of `n_init` will change from 10 to 'auto' in 1.4. Set the value of `n_init` explicitly to suppress the warning
warnings.warn(
/usr/local/lib/python3.9/dist-packages/sklearn/cluster/_kmeans.py:870: FutureWarning: The default value of `n_init` will change from 10 to 'auto' in 1.4. Set the value of `n_init` explicitly to suppress the warning
warnings.warn(
/usr/local/lib/python3.9/dist-packages/sklearn/cluster/_kmeans.py:870: FutureWarning: The default value of `n_init` will change from 10 to 'auto' in 1.4. Set the value of `n_init` explicitly to suppress the warning
warnings.warn(
/usr/local/lib/python3.9/dist-packages/sklearn/cluster/_kmeans.py:870: FutureWarning: The default value of `n_init` will change from 10 to 'auto' in 1.4. Set the value of `n_init` explicitly to suppress the warning
warnings.warn(
/usr/local/lib/python3.9/dist-packages/sklearn/cluster/_kmeans.py:870: FutureWarning: The default value of `n_init` will change from 10 to 'auto' in 1.4. Set the value of `n_init` explicitly to suppress the warning
warnings.warn(
/usr/local/lib/python3.9/dist-packages/sklearn/cluster/_kmeans.py:870: FutureWarning: The default value of `n_init` will change from 10 to 'auto' in 1.4. Set the value of `n_init` explicitly to suppress the warning
warnings.warn(
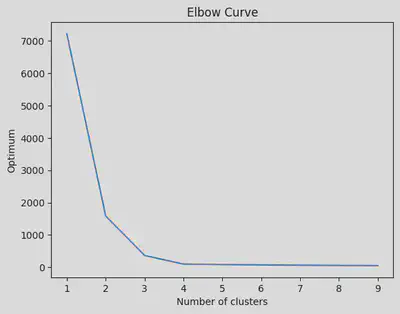
From the curve given below, we see that the optimum value = 3
# Plotting the elbow curve:
number_clusters = range(1, 10)
plt.plot(number_clusters, optimum)
plt.title("Elbow Curve")
plt.xlabel("Number of clusters")
plt.ylabel("Optimum")
Text(0, 0.5, 'Optimum')
Implement the K Means on the iris dataset:
df = pd.read_csv("/content/IRIS_dataset.csv")
df = df.drop(['species'], axis=1)
df.head()
| sepal_length | sepal_width | petal_length | petal_width | |
|---|---|---|---|---|
| 0 | 5.1 | 3.5 | 1.4 | 0.2 |
| 1 | 4.9 | 3.0 | 1.4 | 0.2 |
| 2 | 4.7 | 3.2 | 1.3 | 0.2 |
| 3 | 4.6 | 3.1 | 1.5 | 0.2 |
| 4 | 5.0 | 3.6 | 1.4 | 0.2 |
<script>
const buttonEl =
document.querySelector('#df-e415e9f4-05c7-4e7a-b16b-647d4cf9e786 button.colab-df-convert');
buttonEl.style.display =
google.colab.kernel.accessAllowed ? 'block' : 'none';
async function convertToInteractive(key) {
const element = document.querySelector('#df-e415e9f4-05c7-4e7a-b16b-647d4cf9e786');
const dataTable =
await google.colab.kernel.invokeFunction('convertToInteractive',
[key], {});
if (!dataTable) return;
const docLinkHtml = 'Like what you see? Visit the ' +
'<a target="_blank" href=https://colab.research.google.com/notebooks/data_table.ipynb>data table notebook</a>'
+ ' to learn more about interactive tables.';
element.innerHTML = '';
dataTable['output_type'] = 'display_data';
await google.colab.output.renderOutput(dataTable, element);
const docLink = document.createElement('div');
docLink.innerHTML = docLinkHtml;
element.appendChild(docLink);
}
</script>
</div>
optimum = []
for i in range(1, 10):
  kmeans = KMeans(i)
  kmeans.fit(df)
  opti_cluster = kmeans.inertia_
  optimum.append(opti_cluster)
/usr/local/lib/python3.9/dist-packages/sklearn/cluster/_kmeans.py:870: FutureWarning: The default value of `n_init` will change from 10 to 'auto' in 1.4. Set the value of `n_init` explicitly to suppress the warning
warnings.warn(
/usr/local/lib/python3.9/dist-packages/sklearn/cluster/_kmeans.py:870: FutureWarning: The default value of `n_init` will change from 10 to 'auto' in 1.4. Set the value of `n_init` explicitly to suppress the warning
warnings.warn(
/usr/local/lib/python3.9/dist-packages/sklearn/cluster/_kmeans.py:870: FutureWarning: The default value of `n_init` will change from 10 to 'auto' in 1.4. Set the value of `n_init` explicitly to suppress the warning
warnings.warn(
/usr/local/lib/python3.9/dist-packages/sklearn/cluster/_kmeans.py:870: FutureWarning: The default value of `n_init` will change from 10 to 'auto' in 1.4. Set the value of `n_init` explicitly to suppress the warning
warnings.warn(
/usr/local/lib/python3.9/dist-packages/sklearn/cluster/_kmeans.py:870: FutureWarning: The default value of `n_init` will change from 10 to 'auto' in 1.4. Set the value of `n_init` explicitly to suppress the warning
warnings.warn(
/usr/local/lib/python3.9/dist-packages/sklearn/cluster/_kmeans.py:870: FutureWarning: The default value of `n_init` will change from 10 to 'auto' in 1.4. Set the value of `n_init` explicitly to suppress the warning
warnings.warn(
/usr/local/lib/python3.9/dist-packages/sklearn/cluster/_kmeans.py:870: FutureWarning: The default value of `n_init` will change from 10 to 'auto' in 1.4. Set the value of `n_init` explicitly to suppress the warning
warnings.warn(
/usr/local/lib/python3.9/dist-packages/sklearn/cluster/_kmeans.py:870: FutureWarning: The default value of `n_init` will change from 10 to 'auto' in 1.4. Set the value of `n_init` explicitly to suppress the warning
warnings.warn(
/usr/local/lib/python3.9/dist-packages/sklearn/cluster/_kmeans.py:870: FutureWarning: The default value of `n_init` will change from 10 to 'auto' in 1.4. Set the value of `n_init` explicitly to suppress the warning
warnings.warn(
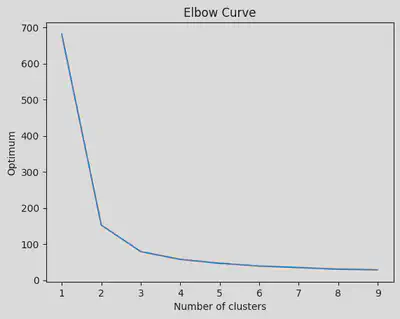
From the curve given below, we see that the optimum value = 3
# Plotting the elbow curve:
number_clusters = range(1, 10)
plt.plot(number_clusters, optimum)
plt.title("Elbow Curve")
plt.xlabel("Number of clusters")
plt.ylabel("Optimum")
Text(0, 0.5, 'Optimum')
kmeans = KMeans(3)
kmeans.fit(df)
/usr/local/lib/python3.9/dist-packages/sklearn/cluster/_kmeans.py:870: FutureWarning: The default value of `n_init` will change from 10 to 'auto' in 1.4. Set the value of `n_init` explicitly to suppress the warning
warnings.warn(
KMeans(n_clusters=3)In a Jupyter environment, please rerun this cell to show the HTML representation or trust the notebook.
On GitHub, the HTML representation is unable to render, please try loading this page with nbviewer.org.
KMeans(n_clusters=3)
kmeans.cluster_centers_ # Showing the coordinates of the 3 centroids.
array([[5.9016129 , 2.7483871 , 4.39354839, 1.43387097],
[5.006 , 3.418 , 1.464 , 0.244 ],
[6.85 , 3.07368421, 5.74210526, 2.07105263]])
kmeans.labels_ # Since we took KMeans(3), we only get 0, 1, 2 values
array([1, 1, 1, 1, 1, 1, 1, 1, 1, 1, 1, 1, 1, 1, 1, 1, 1, 1, 1, 1, 1, 1,
1, 1, 1, 1, 1, 1, 1, 1, 1, 1, 1, 1, 1, 1, 1, 1, 1, 1, 1, 1, 1, 1,
1, 1, 1, 1, 1, 1, 0, 0, 2, 0, 0, 0, 0, 0, 0, 0, 0, 0, 0, 0, 0, 0,
0, 0, 0, 0, 0, 0, 0, 0, 0, 0, 0, 2, 0, 0, 0, 0, 0, 0, 0, 0, 0, 0,
0, 0, 0, 0, 0, 0, 0, 0, 0, 0, 0, 0, 2, 0, 2, 2, 2, 2, 0, 2, 2, 2,
2, 2, 2, 0, 0, 2, 2, 2, 2, 0, 2, 0, 2, 0, 2, 2, 0, 0, 2, 2, 2, 2,
2, 0, 2, 2, 2, 2, 0, 2, 2, 2, 0, 2, 2, 2, 0, 2, 2, 0], dtype=int32)
kmeans.n_iter_
5
three_clusters = kmeans.fit_predict(df)
df_with_clusters = df.copy()
df_with_clusters["clusters"] = three_clusters
/usr/local/lib/python3.9/dist-packages/sklearn/cluster/_kmeans.py:870: FutureWarning: The default value of `n_init` will change from 10 to 'auto' in 1.4. Set the value of `n_init` explicitly to suppress the warning
warnings.warn(
df_with_clusters.head()
| sepal_length | sepal_width | petal_length | petal_width | clusters | |
|---|---|---|---|---|---|
| 0 | 5.1 | 3.5 | 1.4 | 0.2 | 1 |
| 1 | 4.9 | 3.0 | 1.4 | 0.2 | 1 |
| 2 | 4.7 | 3.2 | 1.3 | 0.2 | 1 |
| 3 | 4.6 | 3.1 | 1.5 | 0.2 | 1 |
| 4 | 5.0 | 3.6 | 1.4 | 0.2 | 1 |
<script>
const buttonEl =
document.querySelector('#df-f810b317-dd63-46aa-9c75-0eb9fa7cd513 button.colab-df-convert');
buttonEl.style.display =
google.colab.kernel.accessAllowed ? 'block' : 'none';
async function convertToInteractive(key) {
const element = document.querySelector('#df-f810b317-dd63-46aa-9c75-0eb9fa7cd513');
const dataTable =
await google.colab.kernel.invokeFunction('convertToInteractive',
[key], {});
if (!dataTable) return;
const docLinkHtml = 'Like what you see? Visit the ' +
'<a target="_blank" href=https://colab.research.google.com/notebooks/data_table.ipynb>data table notebook</a>'
+ ' to learn more about interactive tables.';
element.innerHTML = '';
dataTable['output_type'] = 'display_data';
await google.colab.output.renderOutput(dataTable, element);
const docLink = document.createElement('div');
docLink.innerHTML = docLinkHtml;
element.appendChild(docLink);
}
</script>
</div>
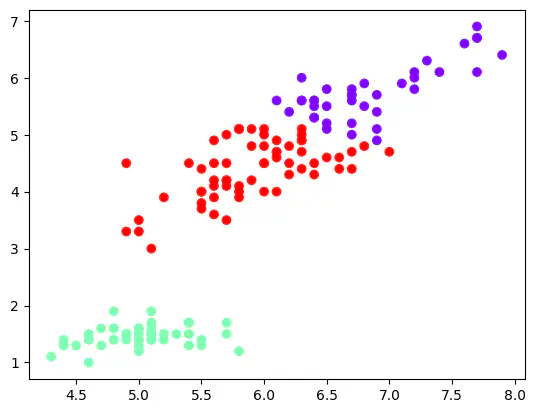
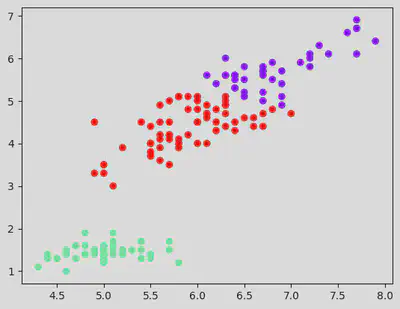
plt.scatter(df_with_clusters["sepal_length"], df_with_clusters["petal_length"], c = df_with_clusters['clusters'], cmap = "rainbow")
<matplotlib.collections.PathCollection at 0x7f9a6bd49e50>
Srihari Thyagarajan
B Tech AI Senior Student
Hi, I’m Haleshot, a senior-year student studying B Tech Artificial Intelligence. I like projects relating to ML, AI, DL, CV, NLP, Image Processing, etc. Currently exploring Python, FastAPI, projects involving AI and platforms such as HuggingFace and Kaggle.